
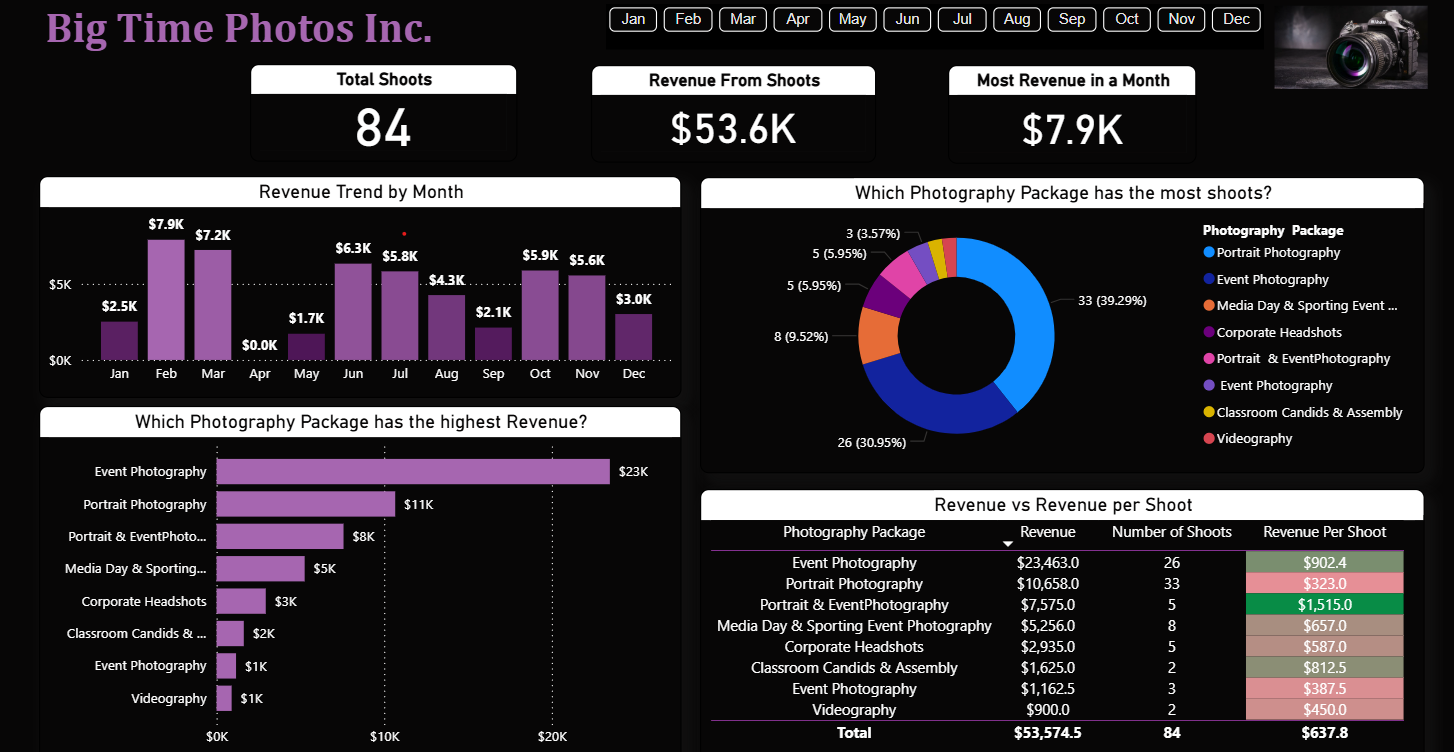
How your data becomes business impact (in 5 simple steps)
The explainer uses sample visuals for clarity. Your real version plugs into your exports (Excel/Sheets/QuickBooks/POS/Shopify/CSV).
What you get — measurable outcomes, not just charts
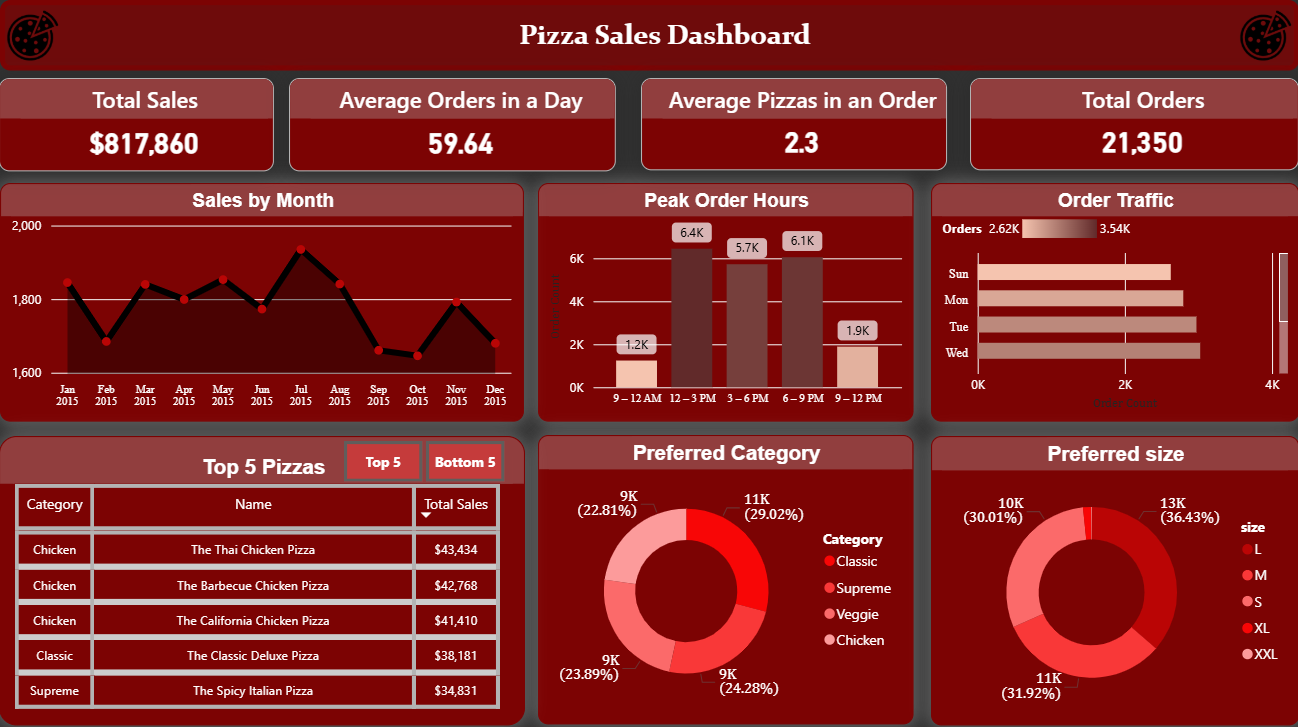
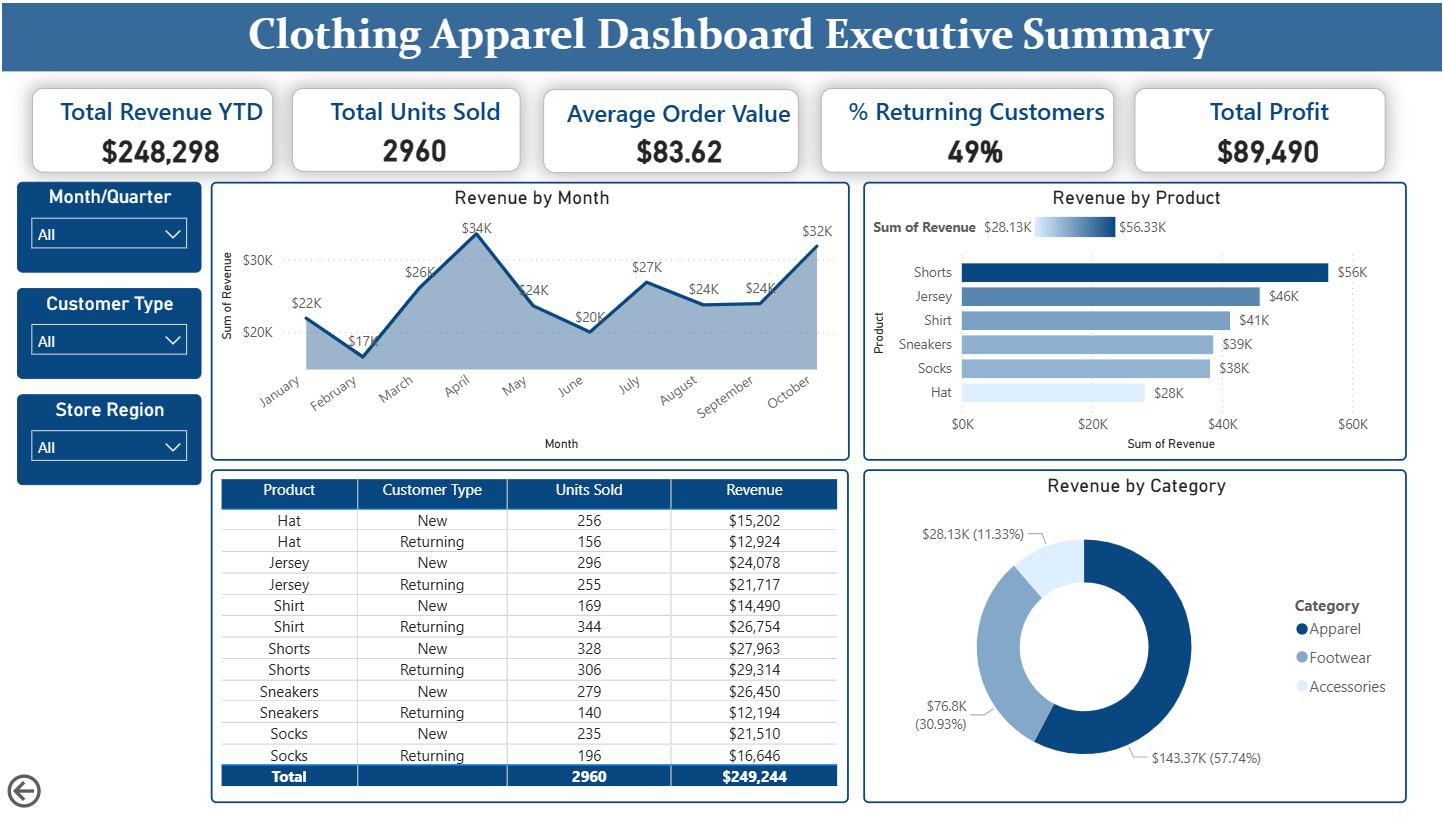
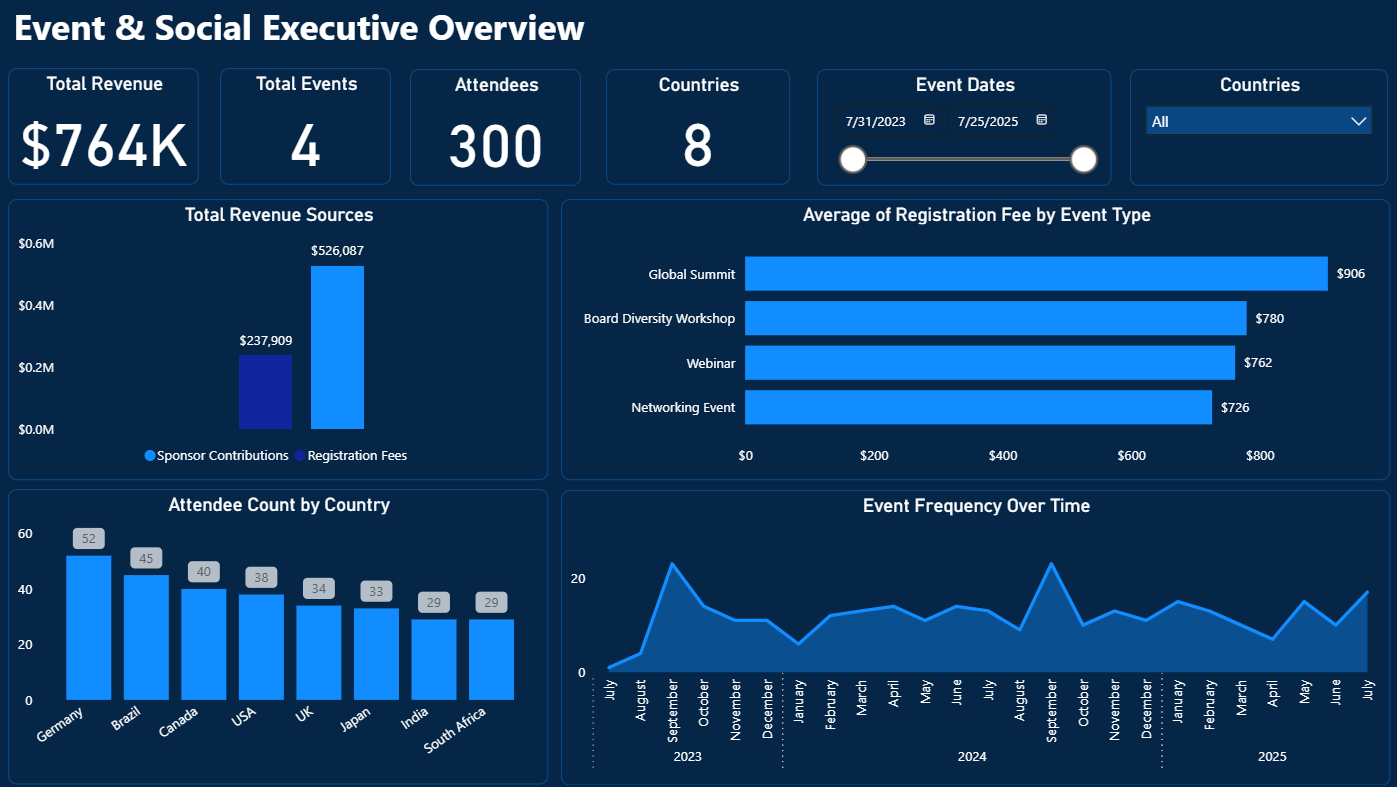
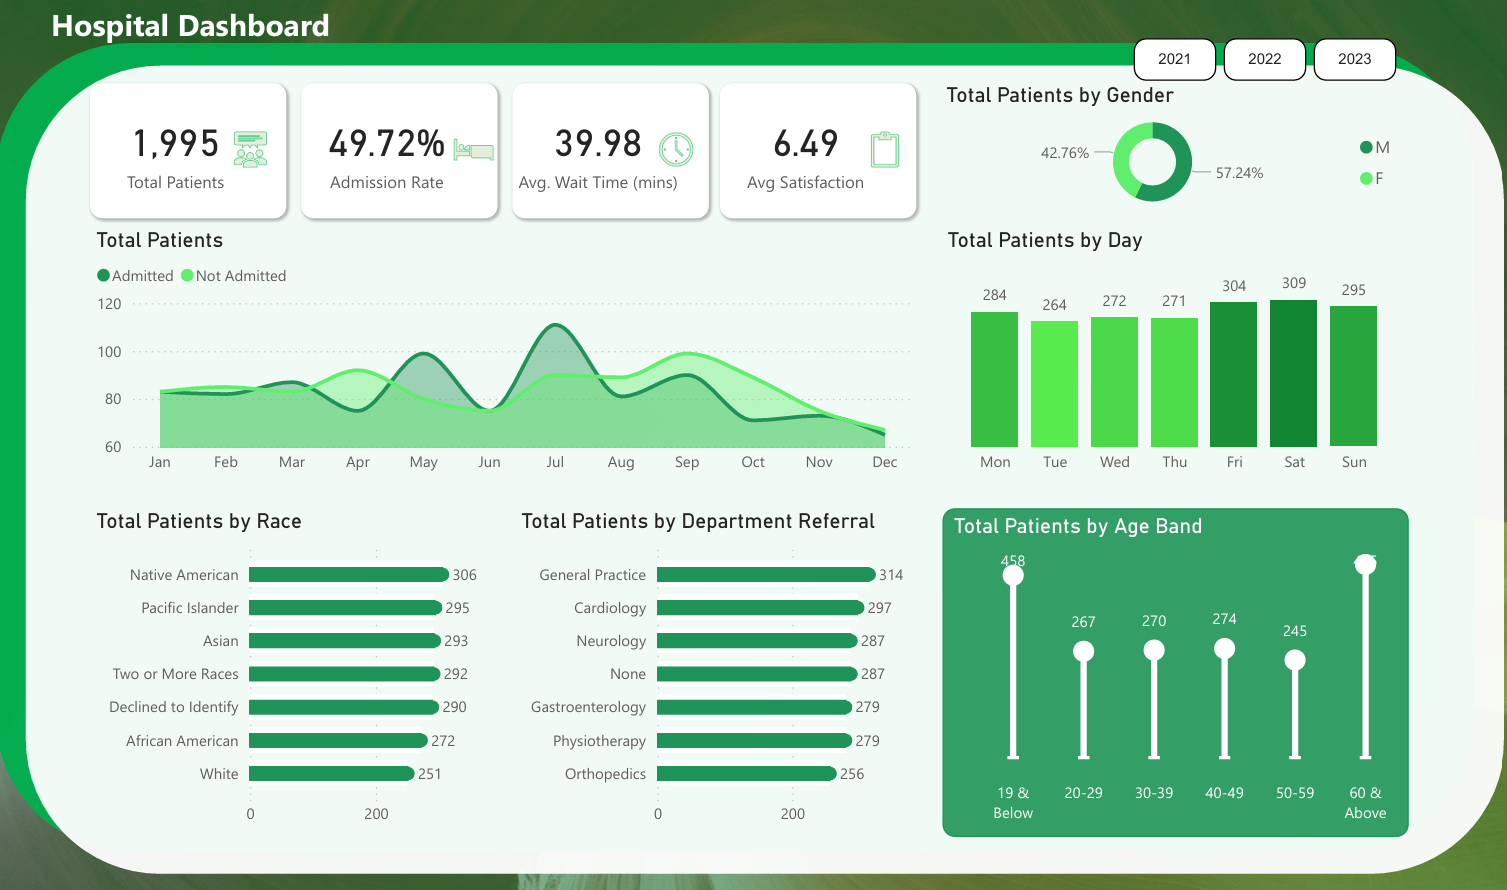
Identify your best products, best customers, best channels, and the real levers behind growth.
Expose waste: discount drift, labor inefficiency, inventory shrink, vendor variance, and process friction.
Flag unusual spikes/drops (refunds, chargebacks, ad spend, returns, stockouts) before they become expensive.
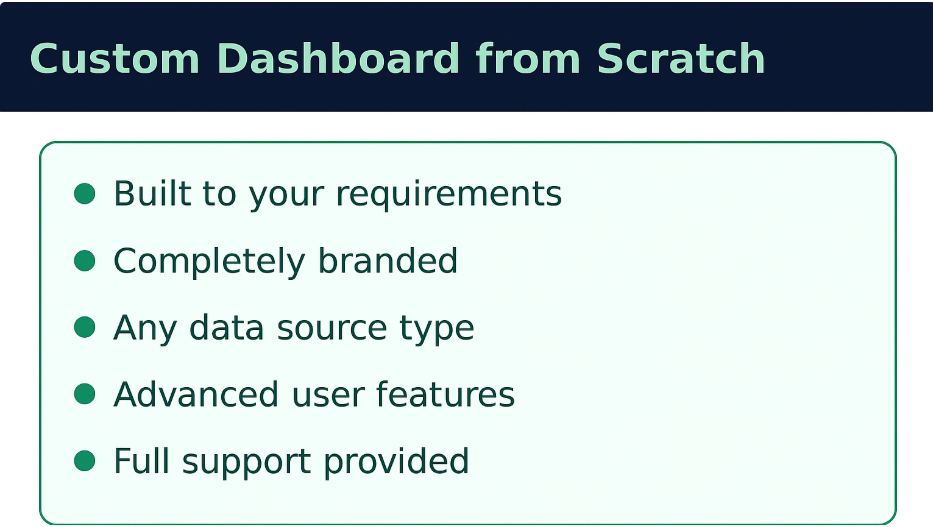
Plug-and-play dashboards (fully customizable)
Start small, prove value, scale what works
Pilot
- 1 dashboard + KPI alignment
- Connect Excel/CSV/Sheets exports
- Insights + next-step roadmap
Essentials
- 2–3 dashboards + light automation
- Driver analysis (what changed + why)
- Share link or refresh schedule
Ongoing
- Monthly enhancements + updates
- New metrics & views as you grow
- Recurring insights review cadence
Hourly
- Dash fixes, modeling, DAX
- Data cleanup + automation support
- Ad-hoc analytics & troubleshooting
Every engagement starts with a 30-min discovery to confirm scope and expected ROI.
A simple, no-surprises process
Confirm goals, KPIs, data sources, and the quickest wins that move profit.
See a working draft using your exports (or realistic sample data if needed).
Lock in refresh, add alerts, and build a weekly decision rhythm around the dashboard.
What clients are saying
Recently worked with me? Leave a review
“Ebo helped us turn confusing sales reports into simple dashboards we use weekly for decisions. Quick turnaround and professional.”
Jane Smith · Washington, DC
Hi, I’m Ebosele Ayewoh — your strategic, fractional BI partner based out of the DMV
I bring analytics and business strategy experience across Amazon, PepsiCo, GE, Johns Hopkins, and Pandora and translate that into simple, high-adoption dashboards for operators and leaders. My focus: profit, efficiency, and early risk detection.
- Revenue: product/channel growth, promo ROI, customer retention
- Cost: labor, inventory, vendor variance, discount drift
- Risk: anomalies, refunds/returns, outliers, data quality checks
- Tools: Power BI, Excel, SQL, Python
- Dashboards + KPI definitions + “what to do next” insights
- Clean data model (so the numbers stay trusted)
- Refresh/automation plan + training for your team
Frequently Asked Questions
I build KPI scorecards, sales & margin dashboards, marketing ROI dashboards, inventory & operations dashboards, and anomaly detection views — mostly in Power BI and Excel.
Usually no. I prioritize what you already use (Excel, Power BI, Sheets, POS exports, QuickBooks, Shopify/CSV). The goal is high adoption with minimal IT lift.
A working prototype can be shown in ~72 hours. Most projects take 2–4 weeks depending on data complexity and automation.
That’s normal. Cleaning, structuring, and validating messy data is part of the job — so you can trust the numbers.
Book a free 30-minute consult
Contact Me
Thanks—your message is on the way ✅
I’ll reply within 1 business day. You can also book time directly:
🔒 Secure Upload Portal
Share your business data safely — handled confidentially.
Use the public link for quick transfers. After onboarding, I can provide a dedicated private link for your organization.
How does the private link work?
- Client-named upload portal (e.g., Acme_FileRequest).
- Only your team uploads; stays separate and traceable.
- Password protection or expiration available on request.